Volumetric Efficiency of a Worn Pump
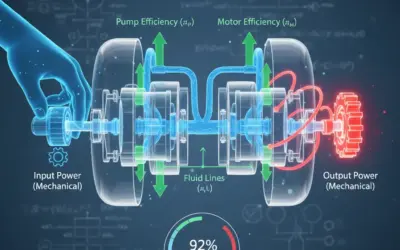
Context: Volumetric EfficiencyThe ratio between the actual flow rate supplied by the pump and its theoretical flow rate (calculated from its displacement and speed). in Fluid Power.
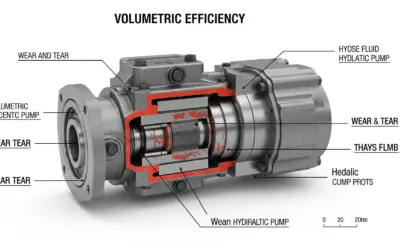
In power hydraulics, pumps are the heart of the system. Over time, internal wear (between pistons and cylinders, gears and housing, etc.) causes leakage. This internal leakageThe flow of oil that returns to the inlet or drain inside the pump instead of being sent to the circuit, due to wear and clearances. causes the actual flow rate of the pump to drop for a given rotational speed. Volumetric efficiency is the key indicator for diagnosing this wear.
Learning Note: This exercise will teach you to quantify pump wear by calculating its volumetric efficiency from manufacturer data and test measurements. You will learn to differentiate between theoretical flow and actual flow and to calculate a leakage flow rate.
Learning Objectives
- Calculate a pump's displacement from its nominal data.
- Calculate an internal leakage flow rate by comparing theoretical and actual flow.
- Determine the volumetric efficiency of a worn pump.
- Quantify the performance drop compared to new condition.
- Understand the impact of pressure on leakage (simplified model).
Study Data
Specification Sheet (Manufacturer)
| Characteristic | Value |
|---|---|
| Pump Type | Piston Pump, Variable Displacement |
| Max Theoretical Flow (\(Q_{\text{th\_spec}}\)) | 11.69 GPM |
| Nominal Speed (\(N_{\text{spec}}\)) | 1500 RPM |
| Max Operating Pressure (\(P_{\text{max}}\)) | 5000 PSI |
| Volumetric Efficiency (New) | ~95% (at \(P_{\text{max}}\) and \(N_{\text{spec}}\)) |
Pump Test Bench Schematic
| Test Parameter | Symbol | Value | Unit |
|---|---|---|---|
| Test Rotational Speed | \(N_{\text{test}}\) | 1500 | RPM |
| Test Pressure Setting | \(P_{\text{test}}\) | 3000 | PSI |
| Measured Actual Flow | \(Q_{\text{actual\_measured}}\) | 10.0 | GPM |
Questions to Solve
- Calculate the pump's displacement (\(V_c\)) in in³/rev.
- Calculate the internal leakage flow rate (\(Q_f\)) in GPM during the test.
- Calculate the volumetric efficiency (\(\eta_v\)) of the worn pump during the test.
- Calculate the efficiency drop (in percentage points) compared to its new condition.
- Assuming a simple linear relationship (\(Q_f = C_f \times P\)), estimate the leakage coefficient (\(C_f\)) of the worn pump in (GPM)/PSI.
Fundamentals of Volumetric Efficiency
A pump's performance is never perfect. Volumetric efficiency is one of the key indicators for measuring it.
1. Theoretical Flow Rate (\(Q_{\text{th}}\))
This is the ideal flow rate the pump *should* provide. It depends only on geometry (displacement) and rotational speed. It does not account for leaks.
\[ Q_{\text{th}} = V_c \times N \]
Where \(V_c\) is the displacement (e.g., in³/rev) and \(N\) is the speed (e.g., RPM).
2. Leakage Flow Rate (\(Q_f\))
This is the volume of oil that, due to wear and internal clearances, is not expelled into the circuit but returns to the inlet (or drain). This flow increases with pressure and wear.
3. Actual Flow Rate (\(Q_{\text{actual}}\))
This is the flow rate that is actually measured at the pump's outlet. It is the theoretical flow minus the leakage.
\[ Q_{\text{actual}} = Q_{\text{th}} - Q_f \]
4. Volumetric Efficiency (\(\eta_v\))
This is the ratio (often as a %) of what actually comes out versus what ideally should have come out.
\[ \eta_v = \frac{Q_{\text{actual}}}{Q_{\text{th}}} \times 100\% \]
A 100% efficiency would mean zero leakage (a perfect pump, which is impossible). A low efficiency (e.g., 70%) indicates a very worn pump.
Solution: Volumetric Efficiency of a Worn Pump
Question 1: Calculate the pump's displacement (\(V_c\)) in in³/rev.
Principle
Displacement (\(V_c\)) is the volume of fluid the pump is designed to move in one complete revolution. It's a fixed geometric characteristic of the pump. We can find it using the manufacturer's theoretical flow rate and the corresponding speed.
Mini-Lesson
Displacement is the "engine" of the pump. If a pump has a displacement of 1.8 in³/rev, it means that (theoretically) it draws in and pushes out 1.8 cubic inches of oil with every turn. The fundamental relationship is: Theoretical Flow = Displacement × Speed, or \(Q_{\text{th}} = V_c \times N\). To find the displacement, we rearrange the formula: \(V_c = Q_{\text{th}} / N\).
Pedagogical Note
For this calculation, we must use the "manufacturer" or "nominal" data (\(Q_{\text{th\_spec}}\) and \(N_{\text{spec}}\)). This data describes the pump in its new, ideal state. We do not use the test data from the worn pump yet.
Standards
There isn't a specific "standard" for this calculation, but it is a universal convention in fluid power. It is crucial to be consistent with units. In the US, displacement is almost always expressed in in³/rev (cubic inches per revolution), sometimes abbreviated "CIR".
Formula(s)
The main formula is the rearrangement of the theoretical flow formula.
Displacement
Assumptions
For this question, we assume the manufacturer's data is accurate and represents the ideal theoretical operation (no leakage) of the pump.
- The specs \(Q_{\text{th\_spec}}\) and \(N_{\text{spec}}\) are reliable.
- This data describes an ideal operation (\(\eta_v = 100\%\) for this theoretical flow).
Given Data
We extract the data from the "Specification Sheet (Manufacturer)".
| Parameter | Symbol | Value | Unit |
|---|---|---|---|
| Manufacturer Theoretical Flow | \(Q_{\text{th\_spec}}\) | 11.69 | GPM |
| Nominal Speed | \(N_{\text{spec}}\) | 1500 | RPM |
Tips & Tricks
Watch the units! The question asks for in³/rev, but the flow rate is given in GPM (Gallons Per Minute). The easiest way is to first convert GPM to in³/min (cubic inches per minute), knowing that \(1 \text{ US Gallon} = 231 \text{ in}^3\). Then, divide by RPM.
Diagram (Before Calculation)
This first step is a direct calculation from nominal data. It does not require a structural analysis diagram.
Calculation(s)
We will detail each step, showing the formula, the substitution of values, and then the result.
Step 1: Convert GPM to in³/min
We start by converting the manufacturer's flow rate into cubic inches per minute.
This gives the theoretical flow in cubic inches per minute:
(Note: We'll use 2700 for calculation, as 11.69 GPM is the rounded value for a pump that produces exactly 2700 in³/min at 1500 RPM).
Step 2: Calculate Displacement in in³/rev
Now we use the main formula:
Substitute the values (Qth = 2700 in³/min, N = 1500 RPM):
The final result for displacement is:
Diagram (After Calculation)
This result is a constant for the pump, not a diagram.
Analysis
We have determined that the pump is a 1.8 in³/rev model. This is a fixed value that will not change, whether the pump is new or worn. It is the pump's geometric "fingerprint". We will use this value as the basis for all following calculations.
Points of Caution
Do not confuse the nominal data (manufacturer, 11.69 GPM) with the measured test data (10.0 GPM). Displacement is ALWAYS calculated from the theoretical/nominal data.
Key Takeaways
- Displacement (\(V_c\)) is a fixed geometric constant of the pump.
- Key formula: \(V_c = Q_{\text{th}} / N\).
- Be careful with GPM to in³/min conversion (factor of 231).
Did You Know?
On variable displacement pumps (like this one), this "1.8 in³/rev" represents the *maximum* displacement (when the pump is at full stroke). The variable mechanism (like a swashplate) allows this displacement to be reduced, sometimes to 0 in³/rev, without changing the motor's speed.
FAQ
Frequently asked questions for this step.
Final Result
Your Turn
If a pump has a nominal flow of 10 GPM at 1800 RPM, what is its displacement in in³/rev?
Memo Card
Question 1 Summary:
- Key Concept: Defining Displacement (\(V_c\)).
- Essential Formula: \(V_c = Q_{\text{th}} / N\).
- Key Pitfall: Use theoretical/nominal data. Convert GPM to in³/min.
Question 2: Calculate the internal leakage flow rate (\(Q_f\)) in GPM during the test.
Principle
The leakage flow is the "lost" flow. It is the difference between what the pump *should* deliver (theoretical flow) and what it *actually* delivers (measured actual flow) under the specific test conditions (speed and pressure).
Mini-Lesson
As seen in the fundamentals, actual flow is the result of leakage: \(Q_{\text{actual}} = Q_{\text{th}} - Q_f\). To find the leakage flow, we simply rearrange this formula: \(Q_f = Q_{\text{th}} - Q_{\text{actual}}\). The key is to calculate the \(Q_{\text{th}}\) *for the test conditions* (correct speed) and use the \(Q_{\text{actual}}\) *measured* during that same test.
Pedagogical Note
We now have two "theoretical flows": the manufacturer's spec (11.69 GPM at 1500 RPM) and the one we must calculate for our test. We must first calculate the theoretical flow the pump *should* have at the test speed (\(N_{\text{test}}\)) using the displacement (\(V_c\)) we just found in Q1.
Standards
Hydraulic pump performance tests are often standardized (e.g., ISO 4409), but the principle of calculating leakage flow remains a basic physical application: (Ideal - Actual = Loss).
Formula(s)
We need two formulas: first, calculate the theoretical flow at test conditions, then calculate the leakage.
Theoretical Flow (at test)
Leakage Flow
Assumptions
We assume the measurement instruments (flow meter, tachometer) are accurate and the test is performed at stable conditions.
- The displacement \(V_c = 1.8 \text{ in}^3/\text{rev}\) (from Q1) is correct.
- The measurements (\(N_{\text{test}}\), \(Q_{\text{actual\_measured}}\)) are reliable.
Given Data
We use our Q1 results and the "Test Bench Data".
| Parameter | Symbol | Value | Unit |
|---|---|---|---|
| Displacement (from Q1) | \(V_c\) | 1.8 | in³/rev |
| Test Rotational Speed | \(N_{\text{test}}\) | 1500 | RPM |
| Measured Actual Flow | \(Q_{\text{actual\_measured}}\) | 10.0 | GPM |
Tips & Tricks
The test speed (1500 RPM) is the same as the nominal manufacturer speed. This simplifies things! The theoretical flow *at the test* (\(Q_{\text{th\_test}}\)) will logically be the same as the nominal manufacturer flow (\(Q_{\text{th\_spec}}\)). We can verify this with the calculation.
Diagram (Before Calculation)
We can represent the theoretical flow as a "large" bar, from which a portion is lost (leakage), leaving the smaller actual flow.
Flow Visualization
Calculation(s)
The calculation is done in two steps: first, find the theoretical flow for the test conditions, then subtract the measured actual flow from it.
Step 1: Calculate Theoretical Flow (at test)
We use the formula with the displacement (\(V_c\)) from Q1 and the test speed (\(N_{\text{test}}\)) :
Substitute the values (Vc = 1.8 in³/rev, Ntest = 1500 RPM):
This gives the flow in cubic inches per minute (in³/min):
Now, convert in³/min to GPM (by dividing by 231):
(Note: As predicted in the tip, we get 11.69 GPM, the same as the manufacturer's spec, because the speed is the same).
Step 2: Calculate Leakage Flow
This is the difference between the ideal (theoretical) and the actual (measured) flow. We use the formula:
Substitute the theoretical flow we just calculated (11.69 GPM) and the measured actual flow (10.0 GPM):
The result is the flow "lost" due to wear:
Diagram (After Calculation)
Revisiting the previous diagram with the calculated value:
Test Flow Distribution
Analysis
The pump "loses" 1.69 GPM due to internal wear when operating at 1500 RPM and 3000 PSI. This leakage flow is significant. This is what explains the slowdown of the cylinders on the press.
Points of Caution
The classic error is to use the wrong theoretical flow. You must always calculate the theoretical flow for the test speed (\(N_{\text{test}}\)), not just use a default value. Here, it was the same, but if the test had been done at 1000 RPM, the \(Q_{\text{th\_test}}\) would have been \(1.8 \text{ in}^3/\text{rev} \times 1000 \text{ RPM} = 1800 \text{ in}^3/\text{min}\), or \(7.79 \text{ GPM}\).
Key Takeaways
- Key formula: \(Q_f = Q_{\text{th}} - Q_{\text{actual}}\).
- Leakage flow is the difference between ideal and actual.
- Always calculate \(Q_{\text{th}}\) using the test speed (\(N_{\text{test}}\)).
Did You Know?
This internal leakage flow is converted almost entirely into heat! The 1.69 GPM leaking at 3000 PSI creates thermal power (\(P = Q \times \Delta P / 1714\)) of about 2.97 HP. A worn pump not only slows down the system, but it also makes it run hotter.
FAQ
Frequently asked questions for this step.
Final Result
Your Turn
At 1500 RPM, another identical but *less* worn pump measured 11.0 GPM. What would its leakage flow rate have been?
Memo Card
Question 2 Summary:
- Key Concept: Leakage Flow Rate.
- Essential Formula: \(Q_f = Q_{\text{th\_test}} - Q_{\text{actual\_measured}}\).
- Key Pitfall: Use \(Q_{\text{th}}\) at \(N_{\text{test}}\) and measured \(Q_{\text{actual}}\).
Question 3: Calculate the volumetric efficiency (\(\eta_v\)) of the worn pump during the test.
Principle
Volumetric efficiency is the pump's "report card". It expresses, as a percentage, how effectively the pump converts its rotation into flow. It's the ratio of the flow that actually comes out (Actual) to the flow that should have come out (Theoretical).
Mini-Lesson
The formula, as seen in the fundamentals, is simple: \(\eta_v = Q_{\text{actual}} / Q_{\text{th}}\). The closer this number is to 1 (or 100%), the less leakage there is, and the better the pump. A new pump has a high \(\eta_v\) (e.g., 95-98%). A very worn pump will have a low \(\eta_v\) (e.g., < 80%).
Pedagogical Note
We already have all the pieces of the puzzle for this calculation! We have the measured actual flow (\(Q_{\text{actual\_measured}}\)) and the calculated theoretical flow at test conditions (\(Q_{\text{th\_test}}\)). We just need to do the division.
Standards
Efficiency is a dimensionless quantity (a ratio), but it is universally expressed as a percentage (%) for easier reading. Therefore, we multiply the ratio by 100.
Formula(s)
The fundamental formula for volumetric efficiency.
Volumetric Efficiency
Assumptions
We assume the calculations from Q1 and Q2 are correct and the measurements are reliable.
Given Data
We use the results and data from the previous questions.
| Parameter | Symbol | Value | Unit |
|---|---|---|---|
| Measured Actual Flow | \(Q_{\text{actual\_measured}}\) | 10.0 | GPM |
| Theoretical Flow (at test) | \(Q_{\text{th\_test}}\) | 11.69 | GPM |
Tips & Tricks
There is another way to calculate \(\eta_v\): using the leakage flow. Since \(Q_{\text{actual}} = Q_{\text{th}} - Q_f\), the formula becomes \(\eta_v = (Q_{\text{th}} - Q_f) / Q_{\text{th}} = 1 - (Q_f / Q_{\text{th}})\). Using \(Q_f = 1.69 \text{ GPM}\) (from Q2) and \(Q_{\text{th}} = 11.69 \text{ GPM}\): \[ \begin{aligned} \eta_v &= 1 - \frac{1.69}{11.69} \\ &\approx 1 - 0.1445 \\ &= 0.8555 \end{aligned} \] We get the same result (85.55%). This is a good way to check your work!
Diagram (Before Calculation)
We can visualize this as a "pie chart" where the missing slice represents the leakage.
Theoretical Flow Distribution
Calculation(s)
We apply the definition of volumetric efficiency using the flow values (Actual and Theoretical) that we know.
Step 1: Calculate the Ratio
We start with the efficiency formula. It's the ratio of actual over ideal:
Substitute the actual flow (10.0 GPM) and the theoretical flow (11.69 GPM). The units (GPM) must be the same to cancel out:
This gives a dimensionless ratio (a simple number):
Step 2: Convert to Percentage
To make it easier to read, we multiply this ratio by 100:
This is the volumetric efficiency (rounded to one decimal place).
Diagram (After Calculation)
The donut chart above visualizes this result.
Analysis
An efficiency of 85.5% confirms the pump is tired. Most press manufacturers consider that a pump whose volumetric efficiency drops below 85% (or even 90% for critical applications) must be replaced or rebuilt. We are right on the line.
Points of Caution
Make sure to divide Actual by Theoretical (\(10.0 / 11.69\)) and not the other way around. Efficiency (except in very rare cases) is always less than 100%. If you get 117%, you've inverted the fraction.
Key Takeaways
- Key formula: \(\eta_v = Q_{\text{actual}} / Q_{\text{th}}\).
- Efficiency is the measure of effectiveness (Actual / Ideal).
- It is a key indicator of wear.
Did You Know?
There is also a mechanical efficiencyThe ratio of theoretical hydraulic power to the actual mechanical power delivered to the pump's shaft. It quantifies friction losses. (losses from friction) and an overall efficiency (\(\eta_{\text{overall}} = \eta_v \times \eta_{\text{mech}}\)). But for diagnosing internal wear and leakage, volumetric efficiency is the most important one.
FAQ
Frequently asked questions for this step.
Final Result
Your Turn
Using the pump from the Q2 "Your Turn" (Qth=11.69, Qactual=11.0), what would the volumetric efficiency be?
Memo Card
Question 3 Summary:
- Key Concept: Volumetric Efficiency.
- Essential Formula: \(\eta_v = (Q_{\text{actual}} / Q_{\text{th}}) \times 100\).
- Key Pitfall: Always \(\eta_v \le 100\%\). Divide Actual / Theoretical.
Question 4: Calculate the efficiency drop (in percentage points) compared to its new condition.
Principle
This question aims to quantify the degradation. We will simply compare the current "report card" (our calculated \(\eta_v\)) to that of a new pump (given by the manufacturer) and find the difference.
Mini-Lesson
The "efficiency drop" or "loss in points" is a simple subtraction. \(\Delta \eta_v = \eta_{v\_\text{new}} - \eta_{v\_\text{test}}\). This gives a very clear number to a technician or maintenance manager. Saying "the efficiency has dropped by 9.5 points" is often clearer than "the efficiency is at 85.5%".
Pedagogical Note
It is important to compare apples to apples. The new efficiency (95%) is given by the manufacturer at nominal pressure and speed. Our test (85.5%) was done at the same speed but at a lower pressure (3000 PSI vs 5000 PSI). Ideally, we should compare it to the "new" value *at 3000 PSI*. But lacking that data, we use the nominal value as our reference.
Standards
No standard here, this is simple arithmetic.
Formula(s)
A simple subtraction.
Efficiency Drop
Assumptions
We assume the "new" efficiency of 95% is a valid benchmark for our comparison.
Given Data
We use the result from Q3 and a value from the problem statement.
| Parameter | Symbol | Value | Unit |
|---|---|---|---|
| Efficiency (new) | \(\eta_{v\_\text{new}}\) | 95 | % |
| Efficiency (test) (from Q3) | \(\eta_{v\_\text{test}}\) | 85.5 | % |
Tips & Tricks
Be careful not to calculate a *relative* percentage change. We are not calculating \( (95 - 85.5) / 95 \). The question asks for the drop in "percentage points", which implies a simple subtraction.
Diagram (Before Calculation)
Visualizing the difference.
Efficiency Drop
Calculation(s)
We calculate the difference (in "points") between the new efficiency and the measured efficiency.
Calculate Efficiency Drop
State the formula for the difference:
Substitute the new efficiency (95%) and our calculated efficiency (85.5%):
The result is the efficiency drop in percentage points:
Diagram (After Calculation)
The bar chart above illustrates this result.
Analysis
The pump has lost 9.5 percentage points of efficiency. This is a significant degradation. If the replacement limit is set at a 10-point drop, this pump is due to be changed.
Points of Caution
As mentioned in the tip, the common mistake is to calculate a relative change. The question is simple: subtract the two percentages.
Key Takeaways
- A "drop in points" is a simple subtraction.
Did You Know?
In "Load Sensing" systems, such an efficiency drop is very problematic. The system compares the pump pressure and the load pressure. A large leakage flow (poor \(\eta_v\)) disrupts this regulation, causing energy loss and heat even when the operator is not demanding flow.
FAQ
Frequently asked questions for this step.
Final Result
Your Turn
If the new efficiency was 96% and the measured efficiency was 91%, what is the drop in points?
Memo Card
Question 4 Summary:
- Key Concept: Quantifying Degradation.
- Essential Formula: \(\Delta \eta_v = \eta_{v\_\text{new}} - \eta_{v\_\text{test}}\).
- Key Pitfall: It's a subtraction (points), not a division.
Question 5: Estimate the leakage coefficient (\(C_f\)) of the worn pump in (GPM)/PSI.
Principle
We are trying to model the wear. We make a simplifying assumption: the leakage flow (\(Q_f\)) is directly proportional to the test pressure (\(P_{\text{test}}\)). The leakage coefficient (\(C_f\)) is the "wear factor" that links the two: \(Q_f = C_f \times P\).
Mini-Lesson
This linear model is a simplification. In reality, the relationship depends on the oil's viscosity (which depends on temperature), the type of leakage (laminar or turbulent), etc. However, this simple model (\(Q_f \propto P\)) is very useful for a first-order estimation. Our coefficient \(C_f\) represents "how many GPM we lose for every PSI of pressure applied".
Pedagogical Note
To find \(C_f\), we rearrange the formula: \(C_f = Q_f / P_{\text{test}}\). We already calculated \(Q_f\) in Q2 (1.69 GPM) and we know the pressure at which this leakage was measured (\(P_{\text{test}} = 3000 \text{ PSI}\)). We can therefore find the coefficient.
Standards
This model is a simplification of the Hagen-Poiseuille equation for laminar flow through a gap, which states that leakage flow is proportional to the pressure differential.
Formula(s)
The formula for the linear leakage model.
Leakage Coefficient
Assumptions
The fundamental assumption is the one given in the question:
- Leakage flow is proportional to pressure (\(Q_f = C_f \times P\)).
- We assume leakage flow is zero at 0 PSI (which is true).
Given Data
We use the result from Q2 and a value from the problem statement.
| Parameter | Symbol | Value | Unit |
|---|---|---|---|
| Leakage Flow (from Q2) | \(Q_f\) | 1.69 | GPM |
| Test Pressure | \(P_{\text{test}}\) | 3000 | PSI |
Tips & Tricks
The unit for \(C_f\) is important: (GPM) / PSI. It's a "slope". This coefficient is very useful because it allows us to estimate the leakage at *any* pressure. For example, at 4000 PSI, we could estimate the leakage as \(Q_f = C_f \times 4000\).
Diagram (Before Calculation)
We are looking for the slope of the line that connects (0 PSI, 0 GPM) to our measurement point (3000 PSI, 1.69 GPM).
Linear Leakage Model
Calculation(s)
We use the simple linear model to find the coefficient \(C_f\), which is the slope of the \(Q_f\) vs. \(P\) line.
Calculate the Coefficient
We start from the formula \(Q_f = C_f \times P\). To find \(C_f\), we isolate it:
Substitute the leakage flow from Q2 (1.69 GPM) and the test pressure (3000 PSI):
This gives the result, with its specific units (GPM *per* PSI):
Diagram (After Calculation)
The diagram above is now complete: the slope of the red line is \(C_f = 0.000563 \text{ (GPM)/PSI}\).
Analysis
This coefficient is the "signature" of the pump's wear. A new pump would have a much lower \(C_f\) (e.g., 0.0001). By tracking the change in this coefficient over time (predictive maintenance), one can anticipate failure before it becomes critical.
Points of Caution
This model is a simplification! It should not be used for high-precision calculations. But for a quick diagnosis and estimation, it is very common and effective.
Key Takeaways
- We can model leakage with: \(Q_f = C_f \times P\).
- \(C_f = Q_f / P\) is an indicator of wear.
- It allows us to estimate leakage at other pressures.
Did You Know?
To be more precise, modern test benches measure leakage at multiple pressure points (e.g., 500, 1000, 1500, 2000 PSI) and plot the complete \(Q_f(P)\) curve. This allows technicians to see if the relationship is truly linear or if it curves (which indicates a change to turbulent flow).
FAQ
Frequently asked questions for this step.
Final Result
Your Turn
If a pump has 2.0 GPM of leakage at 2500 PSI, what is its \(C_f\)?
Memo Card
Question 5 Summary:
- Key Concept: Linear leakage modeling.
- Essential Formula: \(C_f = Q_f / P\).
- Key Pitfall: This is a simplified estimation.
Interactive Tool: Wear Simulator
Use this tool to see how leakage flow and volumetric efficiency change based on operating pressure and the level of wear (the \(C_f\)).
Input Parameters
Key Results (at 1500 RPM)
Final Quiz: Test Your Knowledge
1. What is displacement (\(V_c\))?
2. If a pump (Vc=2.0 in³/rev) runs at 1000 RPM, what is its THEORETICAL flow?
3. Volumetric efficiency (\(\eta_v\)) is calculated as:
4. What does a low volumetric efficiency (e.g., 75%) indicate?
5. In our exercise (Qf = 1.69 GPM at 3000 PSI), what would happen if the pressure increased?
Glossary
- Displacement (\(V_c\))The theoretical volume of fluid (in³ or cm³) that a pump or motor moves in one complete revolution of its shaft.
- The theoretical volume of fluid (in³ or cm³) that a pump or motor moves in one complete revolution of its shaft. It is a fixed geometric characteristic.
- Leakage Flow Rate (\(Q_f\))The flow of oil that returns to the inlet or drain inside the pump instead of being sent to the circuit, due to wear and clearances.
- The flow of oil that returns to the inlet or drain inside the pump instead of being sent to the circuit, due to wear and clearances.
- Theoretical Flow Rate (\(Q_{\text{th}}\))
- The ideal flow rate (e.g., GPM) calculated from displacement and speed (\(Q_{\text{th}} = V_c \times N\)), without accounting for leakage.
- Actual Flow Rate (\(Q_{\text{actual}}\))
- The flow rate (e.g., GPM) that is actually measured at the pump's outlet. It is always less than or equal to the theoretical flow.
- Volumetric Efficiency (\(\eta_v\))The ratio between the actual flow rate supplied by the pump and its theoretical flow rate (calculated from its displacement and speed).
- The ratio (as a %) of actual flow rate to theoretical flow rate (\(\eta_v = Q_{\text{actual}} / Q_{\text{th}}\)). It is the primary indicator of internal wear.
0 Comments